H2S is a radar device carried in aircraft to produce on a cathode ray tube a picture of the area over which the aircraft is flying. This picture on the tube gives the crew the positions of coastlines, large man-made structures and built-up areas, relative to the position of the aircraft.
By means of H2S the navigator can:-
and the more faithful the picture on the tube the more easily and accurately can these four things be done.
2. An Outline of the System H2S Mark I
A pulsed magnetron transmitter feeds to a horizontal dipole aerials the pulses being of one microsecond duration at a recurrence frequency of 660 pps. The dipole aerial is placed in the focal plane of a paraboloid mirror, the properties of the mirror and dipole assembly resulting in the production of a wedge-shaped beam of radiation. The beam has a width of about 8° in the horizontal plane and 50° in the vertical plane. The mirror and aerial are rotated through 360° so that the wedge-shaped beam sweeps over the region under the aircraft approximately once per second.
Since towns reflect more energy than open country areas, and open country areas more than stretches of water, when the radiation strikes the ground, some energy is reflected back to the aircraft, the actual amount depending upon whether the ground illuminated is town, country or waters. The mirror and dipole used for transmission serve also for reception and some of this reflected energy is collected by the mirror and after passing through a high gain amplifier is displayed on a cathode ray tube.
To portray the desired information conveniently, two cathode ray tubes are used. The first of these is the PPI using a rotating time base which is obtained by passing a sawtooth through a rotating transformer. Echoes received from objects in the area scanned by the rotating beam appear as bright spots on the PPI due to the grid of the PPI being set at a potential sufficiently negative with respect to the cathode for the time base not to paint in the absence of signals. The signals are applied to the grid of the tube as positive going pulses and raise the grid potential sufficiently for the time base to be painted for the duration of the signal.
The time base is arranged to start at the centre of the tube at the instant the pulse is transmitted and move out to the edge at a constant velocity, and to rotate around the face of the tube in synchronism with the movement of the scanner mirror.
Thus an object giving a sufficiently strong return echo will cause a bright spot to appear on the PPI. The position of this spot is related to the centre of the tube as the object on the ground is to the aircraft, since the distance from the centre of the tube is proportional to the time between the transmitted pulse and received echo and hence to the distance from the aircraft to the reflecting object. The radial position of the spot is given by the direction in which the mirror is pointing as it illuminates the object.
Since towns are collections of small reflecting objects the PPI shows the shape of the town as the collection of bright spots on the tube, and if there are several town or other sources of returned echoes the PPI also shows the relative positions of these towns with respect to one another and to the aircraft. The PPI is a radar map of the terrain beneath the aircraft.
Before this map can be of use to the navigator he must know on what scale the map is drawn and if he is to correlate it with his topographical charts or maps he must be able to orientate it with respect to some point of the compass. To give him this information a marker pip is superimposed on the signals applied to the PPI and as the time base rotates this pip describes a circle on the tube. The radius of the circle is calibrated in miles and is adjustable at will by the operator. Thus he can set the marker to any desired radius in miles and note the position of the returns on his tube or alternatively set the marker on an echo, and by reading the calibration scale learn the range of that particular object. By taking information from the DR Compass the picture is automatically and continuously rotated so that a radius vertically upward from the centre of the tube screen always represents magnetic north. Then on the picture the time base is brightened up as the scanner passes through the dead ahead position of the aircraft giving a marker showing the course of the aircraft relative to the radar map.
The operator can therefore fix his position by correlating the radar picture with his standard map or chart and in addition has an indication of the course set.
The system as described so far provides the navigator with sufficient information to enable him to reach the target area. To this is added a very simple and comparatively crude form of bombsight. It will be realised that when the equipment is airborne no echoes are received in the interval between the transmitter pulse and the echo from the ground immediately below the aircraft, there being no objects to give echoes at ranges shorter than this. A measurement of this time interval by means of a marker similar to the range scale marker described above, gives an accurate measure of the aircraft's height above ground. When this height together with the aircraft's ground speed, obtained previously from the PPI picture, are set into a small computor, the range marker shows the forward throw of the bomb. The ground track which the aircraft is making is obtained by applying a drift correction to the electrical course marker on the PPI, then the intersection of the bombing marker ring and the track line shows the point of impact of the bombs. The aircraft is flown so that this intersection crosses the aiming point and at the moment of crossing the bombs are released.
3. The System in detail
The system will now be described in greater detail and as far as possible the reasons (even though some are now known to be based on false information) why the particular method was chosen.
(i) The rotating time base
To obtain a rotating time base it is necessary to apply sweep volts to both the X plates and the Y plates. The amplitude of the scan waveform applied to the X plates must vary as Sin ωt and the scan waveforms of the Y plates as Cos ωt, ω being angular velocity of the scanner.
In H2S Mark I these scan waveform components are obtained by producing a single saw tooth waveform and passing this through the rotating winding of a 'magslip'. The magslip has two stationary windings at right angles so that as the rotor moves the scan waveform induced in the stator is proportional to Sin ωt and Cos ωt. The output of the stators is then applied through transformers to the X and Y plates respectively of the PPI. It should be recognised that if the spot is always to start at the centre of the tube independently of the amplitude of the scan waveform on the X or Y plates the scan voltages must be applied by D.C. connection or the waveform must be balanced so that as the positive stroke decreases in amplitude there must be a corresponding decrease in a negative direction so that the zero point remains at the mean A.C. level.
This point can be put more clearly by reference to a diagram.
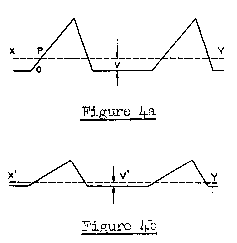
If a scan waveform as in Figure 4a is applied across the X plates of a C.R.T. a time base with the point P at the electrical centre of the tube will be obtained (P being on the line of the mean AC level denoted by XY). A DC 'shift' potential applied to the correct plate Figure 4.b would bring the point 0 to the electrical centre. However, when the amplitude has decreased to one half (i.e. 30° position of our rotating time base) the point P would no longer be at the centre nor would the application of V volts bring the point 0 to the centre. However, if the scan waveform is as in Figure 5 AB, BC CD, etc. being straight lines the point P, the mid point of AB, is on the AC level line XY for all values of the amplitude V, and such a waveform modulated by Sine wt and Cos wt applied to the X and Y plates of a C.R.T. Figure 5 would give a diametrical time base pivoting about the centre of the screen, the centre corresponding to the point P.
Although some later marks of H2S use the waveform of the type in Figure 4, DC fed to avoid the centre of the picture floating due to the change of AC level as the scan waveform varies in amplitude as Sin or Cos ωt, on H2S Mark I the Figure 5 type of waveform is used.
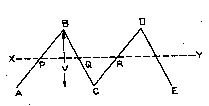
Figure 5.
The waveform is obtained by producing a square wave corresponding to the time intervals AB and BC and feeding this to a double diode triode and a pentode to obtain the required sawtooth.
(It is important to notice that the slope of the flyback must be governed so that the trace does not become of the type in Figure 4). This scan waveform is then passed to a single valve amplifier with feedback to ensure that compensation for losses in the lower frequencies due to subsequent cabling and transformers is made. Then as described above the waveform is passed through a magslip to obtain components in quadrature and then to the PPI plates. This then gives a rotating diametrical scan. The H2S picture is, however, painted by the spot starting at the centre of the screen, so it is necessary to arrange for the transmitter to be pulsed as the scan waveform passes through the mid position, i.e. the point P in Figure 5.
Summarising the scan waveform circuitry it is seen that there is a square wave generator in which both the 'mark' and 'space' intervals must be governed, a scan valve in which both the forward and backstroke speeds must be governed, and a valve to provide a trigger pulse for the modulator in synchronism with the scan waveform.
Although such a system cannot be flexible in that any ancillary equipment giving signals to be displayed on the H2S must be governed for recurrence frequency and phase by the waveform generator of the main equipment, it is very easy to change the phase of the transmitted pulse relative to the scan waveform and for reasons given below this is essential
(ii) Distortion of the H2S Map
A linear waveform of the type shown in Figure 5 gives a very distorted radar map. The distance of the signal on the PPI from the centre of the tube is proportional to the time taken for the signal to travel the return distance AC, i.e. is proportional to slant range. Therefore, whereas the signals corresponding to C and C' in Figure 6 are required to be painted at distances proportional to BC and
BC' they are in fact painted at distances proportional to AC and AC'.
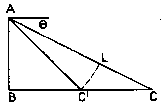
Figure 6.
If C and C' are objects at the far and near edge of the town respectively the town although having a diameter of CC' is painted as if the diameter were (AC - AC') i.e. LC which equals CC' x Cos θ. Thus for large values of θ corresponding to short range targets the difference becomes excessive and towns painted on the PPI lose their characteristic shape. If the distance of the signal from the centre of the PPI is plotted against the time interval between the transmitter pulse and returned echo, the system as described above will give the straight line through the origin (OA), whereas the curve required is the hyperbola 0"B where 00" corresponds to the time interval between the transmitter pulse and the first ground return, i.e. height. (Obviously for a true map of the terrain the first ground return should be at the centre of the screen).
If a linear time base of the form Figure 5 is to be used, then distortion is bound to occur, but from the point of view of navigation this is not important since the distortion is only appreciable with signals at close range and normally the aircraft during its flight to the target does not fly directly over or near large built-up areas or towns. It is in fact routed to avoid such places as far as possible, and when at the target a bomb throw of approx. two miles means that the operator has lost interest in the target after he has approached to within this range. Efforts are made therefore to minimise the distortion at bomb release point. This is achieved by phasing the signals relative to the scan waveform so that line OA Figure 4 is displaced to O'A'.
The time interval 00' was made approximately equal to h/2 so that the true curve (the hyperbola 0"B) and the actual curve (the line O'A') intersected at P the bombing point. The picture then is reasonably faithful up to bombing point. Over the part of the hyperbola Q outwards the true curve is sensibly linear and the shapes obtained are true but slightly displaced. In the region of P they are slightly fore-shortened.
To achieve this partial correction of the picture it was necessary to phase back the transmitter along the scan waveform so that it radiated at a point corresponding to h/2 before the spot describing the diametrical scan reached the centre of the tube.
So that the operator can at will choose between having a picture of a small area with a large amount of detail or alternatively a picture of a large area with a consequent reduction in the detail painted, the slopes of the lines O'A' (and in later equipments the hyperbola 0"B) are made variable and by turning a switch the operator can paint the terrain to a radius of 10 miles round the aircraft on the PPI, or to radii of 30 miles 50 miles or 100 miles.
iii) The Marker Circuits
As stated above it was found necessary to have two markers, a height marker and a range marker (also used as bombing marker). The only requirement here was accuracy and stability of calibration.
(a) Height and range markers
It is not possible to deal in detail with the circuits used to produce these markers since many precautions are necessary to ensure a stable and accurate calibration. The method is in each case the production of a linear sawtooth, this being fed to the grid of a valve which fires as the sawtooth crosses the grid base. The point at which the valve fires is varied by changing the reference level of the sawtooth. The height or range measurement is made by calibrating the potentiometers from which these reference potentials are taken.
(b) Line of Flight Marker
This marker is obtained by the circuit in Figure 8. The Switch S, normally open, is closed as the scanner passes through the fore and aft line of the aircraft. This produces a negative sawtooth waveform at A which lasts 2000 microsecs. (i.e. greater than the time interval between two pulses) so that although the
closing of S is not connected in any
way with the scan waveforms, the marker
signal extends from one pulse to the
next.
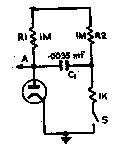
Figure 8.
It should be noted that the end of the Line of Flight marker is determined by the time constant R1 Cl and not the re-opening of S. This means that only the closing of S has to be Figure 8. controlled and is therefore much easier mechanically. If the Line of Flight Marker is not required R2 is switched from the 300v. line to ground.
(c) Range Calibration Drum
On the shortest range picture (10 miles radius) which
is intended primarily for the bombing run, the ground ranges are very different from the slant ranges which the marker, being a measurement of time, actually measures, and since the operator is interested in ground ranges only, some form of conversion of slant
range to ground range is necessary. To achieve this a drum some two inches wide is attached to the range marker setting knob and to this a scale, engraved with a family of curves, attached. The curves are drawn so that when a pointer is set by the process of setting the height marker on to the leading edge of the ground returns, at a distance across the drum proportional to height and the drum rotated by an amount proportional to slant range (this is done when the marker ring is set against the signal on the PPI) the ground range is shown by the curve against the height pointer. To achieve greater accuracy of ground range measurement especially at short ranges, the range as measured on the drum is slant range minus height and the curves work out the height/slant range/ground range triangle from knowledge of the height and slant range minus
height. The distance slant range minus height is
obtained by using the height marker to trigger the range marker circuit, thus a slant range equal to the height corresponds to zero rotation of the range marker drum.
On the longer ranges where the difference between ground range and slant range is negligible the calibration of the range marker knob is for slant range only. The marker circuit is triggered in synchronism with the transmitter and the scale indicates slant range direct.
Since the smallest scale map provided is one with a radius of 100 miles the calibration of the range marker has to extend to 100 miles but it would cause unnecessary errors if the operator had to use a 0-100 miles calibration when he was only interested (on the largest scale picture) in objects out to 10 miles. It is therefore necessary when changing the scale of the picture to change the scale of the range marker calibration so that on the 10 mile radius picture the operator has a scale calibrated from 0-10 miles and on the 30 mile radius picture, 0-30 miles.
It was possible that the change in character of the picture when switching from a small to a large scale picture would confuse the operator and cause him difficulty in recognising his pin point on the new picture, and a method of overcoming this had to be devised.
The change of the scale of the picture and the marker are not changed simultaneously in a single step of the scan-length selector switch but starting with the smallest scale picture of the H2S responses the operator has a 50 mile radius picture and a 0-100 mile marker. Then as the aircraft approaches to within 30 miles of the target the operator rotates the switch through one position and obtains a 30 mile radius picture but retains his 0-100 mile marker. This means that any object on which the marker is set on the small scale picture is still against the marker on the larger scale picture. Having identified his target on the new picture the operator turns the switch through another step, and, keeping the 30 mile picture, changes to the more accurate 0-30 miles range marker. As the aircraft approaches to within 10 miles of the target the operator switches to a 10 mile picture and a 0-10 mile marker through two stages as in the previous change, first picture scale and then range marker scale being changed.
Figure 9 shows the scale which is fitted to the range marker setting knob to give three ranges of calibration, a set of bombing curves and a set of '30 second lines'.
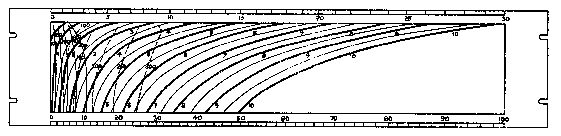
Figure 9.
(d) Bombing Curves
In the interests of simplicity the only form of ranging computation in H2S Mark I is the provision on the range marker scale of a series of curves. Each curve shows the variation between slant range to the bombing point and height for a particular ground speed, the range of possible ground speeds being covered by curves at 50 m.p.h. (50 knots) intervals. The forward bomb throw shown is that of an ideal bomb.
Unfortunately when H2S Mark I first went into the Service, due to imperfections in the dipole and mirror system, towns at a ground range of two or three miles were not illuminated and when doing a bombing run the echoes from the target disappeared as the aircraft approached bomb release point. To overcome this difficulty a second set of curves was drawn on the range marker drum showing the slant range of the bomb throw at a time 30 secs. before the actual time of bomb release.
By means of this second set of curves (shown dotted on Figure 9) the operator, having ensured that the aircraft is making good the right track for bombing, can set the marker to the "30 sec" line for his particular height and ground speed, and, as the aiming point crosses the intersection of the track and bombing marker, start timing the 30 sec. interval at the expiry of which the bombs are released. If during the 30 sec. interval, i.e. inside approximately 3 miles, the town ceases to paint on the PPI, it is still possible to conclude the bombing run. This method of overcoming the short-comings of the aerial system is not completely satisfactory in that it requires the aircraft to fly straight and level for 30 secs. and greatly increases possible bombing errors. The equipment did not lend itself to a more complete solution and until Mark IV (q.v.) all the effort has been put into improving the polar diagram cover of the aerial system.
(iv) Signal Channel
(a) Modulator
The synchronising pulse referred to in paragraph 3(i) is caused to trip a multivibrator circuit in the modulator. The output of this multivibrator is a pre-pulse square wave nominally 20 microsecs. duration and +50v. in amplitude, and its trailing edge is used to fire the transmitter and to synchronise all the timing circuits.
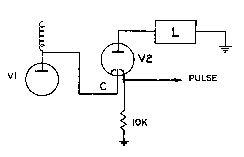
Figure 10.
The pulse forming circuit is shown in Figure 10. A trigger pulse of approximately -2 kV is produced by V1 from the trailing edge of the pre-pulse and fed to the subsidiary cathode C of V2. V2 is a spark gap capable of withstanding 7.2 kV between the anode A and the main cathode B, in the absence of an ionising agent, but during the discharge of the trigger pulse between C and B a spark occurs and delivers power into the line L.
The output of the line is a pulse of amplitude 3.3 kV and duration set by the effective length of the delay line L. In the case of H2S Marks I to III it is one microsecond.
(b) Transmitter
The transmitter is pulsed by applying the waveform generated in the modulator to the cathode of the
magnetron transmitting valve. The pulse applied is produced as 'square' as possible with steep leading and trailing edges so that over the time interval during which the valve is to transmit there is a difference of potential between anode and cathode of approximately 13 kV and during the quiescent period between pulses the anode and cathode are both at earth potential.
It is difficult to maintain at high altitudes the necessary insulation to enable a pulse of 13 kV to be piped from the modulator to the transmitter, and for this reason the pulse is produced at a level of 3.3 kV at the Modulator and amplified to the necessary 13 kV by means of a transformer in the transmitter box. This transformer has to have a response curve sensibly flat up to 2.5/T megacycles. (T being the pulse width in microseconds) so that the shape of the pulse is maintained at the output of the transformer. The chief difficulty in the design of these transformers has not been to get the necessary frequency response, but to avoid breakdown of insulation due to the 13 kV across the secondary.
In the S band transmitter units the R.F. output is fed into a concentric line and through a concentric cable to the scanner. At the higher frequencies of X band this would have caused intolerable losses in the system and the magnetron output is probe-fed into rectangular waveguide and this is continued through the scanner.
The scanner is used for both transmission and reception; a switch is therefore necessary between the magnetron and the scanner so that immediately after the end of the transmitter pulse the scanner can be switched to the receiver channel. The switching is accomplished by means of a T.R. cell. The T.R. cell consists of a chamber resonant at the transmitter frequency so shaped that the spacing between the sides of the cell is very small on the axis of the chamber. The The chamber is sufficiently energised by the R.F. power of the magnetron to arc over at this 'gap' on the axis but the voltages set up by the receiver signals are not great enough for this.
A 'T' junction is made in the R.F. line, one limb being connected to the Scanner, another to the magnetron and a third to the receiver. The arrangement is as sketched in Figure 11.
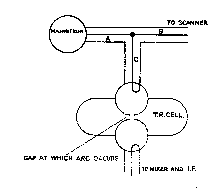
Figure 11.
During the transmitter pulse no power passes down limb C due to the short-circuiting effect of the arc in the TR cell, while between pulses all the received energy passes through the TR cell to the receiver amplifier.
The received signals pass immediately from the TR cell into a crystal mixer and then into a high gain I.F. amplifier. The local oscillator is housed in the Indicator in H2S Marks I and II and in the transmitter box in Mark III. The reason for this being that when H2S was being designed the local oscillators were not very reliable and it was thought that some adjustments would have to be made during flight and the valve be available to the operator.
The local oscillator has now proved itself and in future equipments will be stowed in the transmitter.
(c) Receiver Unit
(i) I.F. Amplifier The signals after one stage of I.F. amplification in the transmitter box are passed to the Receiver Unit which contains a six stage I.F.
amplifier. The I.F. stages are mounted on a separate sub-chassis together with a diode detector and one
stage of video output. The amplifier is designed to
give at the detector a positive signal of approximately 8 volts amplitude, the noise amplitude being 5 volts at maximum gain. The frequency band is centred around 13.5 megacycles with a bandwidth measured at 6 db points of 7-8 megacycles.
It can be shown that the optimum band width for PPI painting is approximately 2/T megacycles (T being the pulse width in microseconds). This is considered to be the best compromise between reproducing faithfully the shape of a square pulse and also retaining a reasonable signal-noise ratio. The reason for 7-8 megacycles instead of the optimum 2 megacycles for the one microsecond pulse of H2S is mainly historical, and is one more legacy (see para. 3(iv)b) of the lack of confidence in the stability of the local oscillator. The wider bandwidth is used to ensure that signals do not fade during flight due to the L.O. gradually drifting off frequency. A manual tuning knob is provided but it is desirable to remove as much as possible the necessity for continual tuning.
(ii) Video Stages The circuits producing various markers referred to in paragraph 3(iii), are housed in the same unit as the I.F. amplifier and before the video signals are passed to the Indicator the line of flight or Heading Marker and the Range (also Bombing) Marker are mixed with them. The line of flight marker is fed as a negative sawtooth to the suppressor of the first video stage resulting in a positive marker being impressed on the video signal output at the anode.
The range marker is mixed with video signals +L.O.F. marker by making the anode load of the first video stage common with the load of the range marker circuit output valve.
The signals and markers are then passed through a cathode follower and out of the Receiver to the Waveform Generator.
The height marker is passed direct from the forming valves to the Indicator.
(iii) Waveform Generator In addition to the circuits producing the scan waveforms referred to in paragraph 3(i) this unit also contains two further video stages.
Reference has already been made in paragraph 2 to a second C.R.T. in the Indicator and in the section on Lucero the need for this additional tube is further explained. In this description of the video signals it is sufficient to say that the waveform generator acts as a junction box splitting the video signals into two channels, one to the PPI and the other to the second
C.R.T. - the "Height Tube". The signals to the "Height Tube" (so called because it is used for setting the height marker to the first ground return) are not affected by the two stages in this unit and pass to Lucero unchanged. The signals for the PPI display are mixed with a bright up square wave and after passing through a cathode follower are fed to the Indicator.
The duration of the square wave is half the time interval of the forward stroke of the scan waveform) starting at the mid point and ending at the end of the forward stroke. The amplitude is approximately 1½ times that of the signal amplitude. The need for such a square wave will be more apparent in the description of the Indicator below.
(iv) Indicator Unit
Before dealing with the treatment of the video signals in this unit, the requirements of the display should be more clearly understood.
There are four distinct levels of signals arriving at
the Indicator; in order of increasing amplitude:-
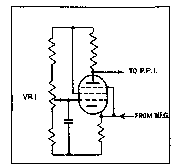
Figure 12.
Figure 12 shows the circuit of the last video valve. The effect of this valve was to 'gate' the signals, that is, the amplitude of big signals was limited to a certain maximum, fixed by the setting of the potentiometer VR1 feeding a D.C. bias to the grid of the valve, and signals smaller than these by an amount equal to the grid base of the valve, were not transmitted at all.
In figure 13(a) the outline represents the signals as fed to the cathode of the valve, the levels marked 1,2, 3, 4 and 5 representing the amplitudes of markers, town returns, ground returns, noise on the brightened up portion of the scan, and noise on the back stroke respectively.
If VR1 is set so that the top limit of the gate is set to level 5, all signals will be limited to the one level and a diametrical time base will appear on the PPI with no signals painting distinctly from the noise background. If the gate is raised to level 4 the signals allowed through the gate will be as in Figure 13(b) and a radial timebase only will be painted, signals and noise except during the bright up square wave interval being suppressed and signals during the writing stroke being limited to noise amplitude and
therefore not painting as discrete echoes.
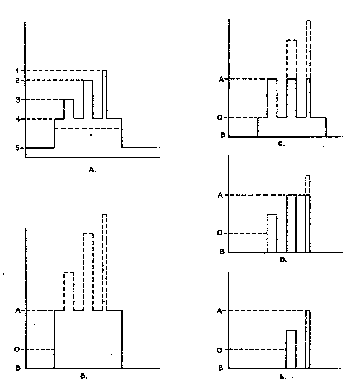
Figure 13.
As the gate is raised through levels 3, 2 and 1, the signals begin to paint more brightly than noise and then the stronger signals more brightly than the weaker ones; the bright up square wave ensuring that signals not on the time base from the centre outwards are suppressed in the limiting or 'gating' valve.
Figures 13(c)(d) and (e) show the way in which the limiting affects the signals when the gate is set to levels 3, 2 and 1 respectively.
The valve in addition to limiting the signals also amplified them so that the amplitude range represented by A-B in each of these figures was sufficient to drive the PPI grid from maximum brightness to cut-off. The bias on the grid of the PPI was then set so that the level A coincided with that for maximum brightness.
In setting up the Indicator the aim was to set the limiting level such that, at maximum gain, noise peaks painted (but not so intensely that they obscured the signal) and the signals were not over driving the tube and coming defocused, i.e. the video valve was working as in Figure 13(c).
The picture with the equipment so adjusted showed all land and town returns as signals of equal brightness: to obtain differences in intensity between signals of different amplitudes, the gain was reduced.
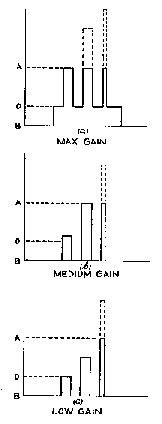
Figure 14.
Figures 14(a) (b) and (c) show the way in which varying the gain from maximum to medium and low settings changed the character of the picture.
It will be seen that these figures are substantially the same as Figures 13(c) (d) and (e). Obviously the same results could have been achieved by working at maximum gain all the time and obtaining the different pictures by raising and lowering the gate, as by maintaining the gate at an optimum level and varying the gain, but the latter was considered easier to do in flight and is largely used now on Operations.
4. Lucero (the inclusion of which constituted the change H2S Mark I to Mark II)
The change from the metre band to the cm. band had robbed the aircraft of all the navigational, blind approach and facilities. To restore these facilities Lucero was included in the H2S system.
Lucero consists of a transmitter on the 1½ metre band, capable of interrogating beacons and identification systems, and the local oscillator and first two IF stages of a receiver. The unit works with an aerial system independent of H2S and mounted so that all round cover and azimuth DF are possible.
The Lucero transmitter is triggered by a pulse from the main equipment so that returned signals from Lucero are in phase with the main equipment signals and scan waveforms.
The returned signals after passing through the two stages of IF amplification in the Lucero unit are mixed with the IF signals of the main equipment and then pass through a common amplifier and detector channel.
It should be noted that although the Lucero is in synchronism with the main equipment and therefore correlated in range with the cm. signals, there is no correlation in azimuth. The Lucero aerials are fixed and arranged to give as far as possible equal illumination in all azimuthal directions. Thus, Lucero signals appear on the PPI whenever a responder is within interrogation range, independently of the position of the rotating time base. Bearing information for use with blind approach systems is, however, obtainable by routing the video signals from the receiver to the indicator through the Lucero, where they are switched to one of two leads depending upon whether the signals were received in the port or starboard aerial. The video signals are then displayed on the second CRT in the Indicator on which signals from the port aerial are shown as deflections of the time base to the left and from the starboard aerial to the right.
If azimuth information is not required, e.g. IFF, the responder signals can be related to the target by the range correspondence.
5. Development of H2S beyond Mark II
In this section points at which the H2S Mark II performance could readily be improved will be described together with the method by which this was done. It should, however, be realised that in the successive changes of H2S the most important factor governing the change of design was the ease with which the existing system could be modified. Before any change could be considered for introduction into the system it was essential to ensure that no large scale production of new units was involved and that the changes required in aircraft fitting were small and did not involve structural alterations to the airframe.
There were still a number of units common to H2S and ASV and in the case of these units, some means had to be devised whereby both Bomber and Coastal Commands' requirements were met with a single unit. This was usually done by means of an internal switch. which was set to either the Bomber or Coastal Command position when the unit was being installed.
(i) Beam width
In the foregoing description of the H2S display it was inferred that a point object on the ground would paint as a single spot on the PPI. This is untrue. Although the introduction of cm. transmitters made H2S possible in that an aerial system capable of giving a narrow beam was still small enough for it to rotate through 360° when installed in an aircraft, the beam was still in the case of H2S Marks I and II some 8° wide.
Thus as the mirror system rotated, when it was pointing within 4° (½ beam width) of an object, the object was sufficiently strongly illuminated for a return echo to be painted on the PPI. This painting continued until the mirror had rotated through a further 8°, after which time the object was not illuminated and no echo was painted. A bright spot was therefore being painted while the mirror rotated through 8° and since the time base rotated in synchronism, the echo painted while the time base rotated through 8°. A point object therefore painted as an 8° arc on the PPI. If a collection of reflecting objects such as a town were being painted the shape would be false due to the objects at the fringe of the area painting for 4° outside the town. The azimuthal width of the town was therefore too great by a beam width (at 5 miles slant range this amounts to approx. ¾ mile). Similarly the echoes from the land immediately surrounding a water-land feature, would spill over the water area by half a beam width at both sides. Thus a lake or river ¾ mile wide would begin to paint inside 5 miles slant range but would disappear at greater ranges.
This is a very obvious limitation of the H2S Mark I and II systems and since the horizontal aperture of the mirror for aerodynamic reasons could not be increased, the beam width was reduced by increasing the transmitter frequency. On H2S Marks I and II it was 3000 megacycles; on H2S Mark III it was increased to 9000 megacycles. This enabled the beam width to be reduced to approx. 3° with a consequent improvement in the fidelity of town painting and water-land features. Lakes and rivers as narrow as one quarter of a mile could be seen but to 5 miles and the accuracy of the town shape improved by a similar amount.
There is probably a limit to the amount by which the beam width can be reduced in that a town response consists of a small number of discrete echoes (places at which a number of surfaces make up an efficient 'corner reflector') and as the aircraft flies over the town the changing aspect of the town causes different points to reflect.
Thus, whereas with existing beam widths the town shows up as a solid mass of return, slightly distorted due to the edge effect of the beam, a very narrow beam will cause the town to break up into a number of isolated and rapidly changing spot echoes. The present reaction of Service personnel is definitely in favour of the solid though distorted town return but they have not had sufficient experience with narrow beam equipments to be able to judge the alternatives reliably.
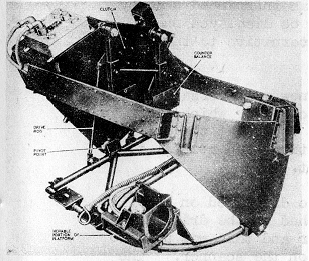
A general view of an H2S Mark III (3 cms.) scanner is seen in Figure 15.
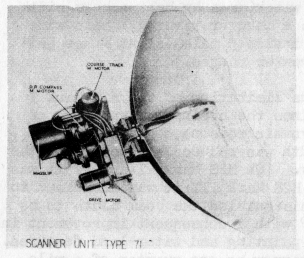
Figure 15.
(ii) Scan Correction
When bombing a town the aiming point is given to the aircrew as some prominent topographical feature, e.g. the main railway station or the civic centre. Such places do not however paint as distinctive returns
in the H2S response of the town
and it is necessary for the operator to estimate the position of the actual aiming point either by reference to the centre of gravity of the complete town response or some prominent feature of the town's outline.
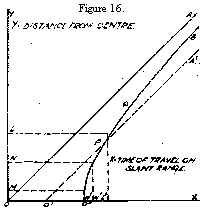 The partial correction of the picture to display
ground range positions described in paragraph 5. resulted in very bad distortion of the picture at ranges less than the bomb throw. Reference to figure 16 will show that the effect of this type of correction
results in the foreshortening of all returns inside P and to a less extent the elongation of echoes outside this point. A town which should be painted with a diameter equal to LM is painted as L'M' and the mid point N is actually painted much closer to the near fringe at N'. An operator presented with the town painted as M'N' would assess the centre of the town at a point much nearer L', and due to the 'knee' in the curve 0"B it can be imagined that the operator could fly completely over the town thinking that the bombing marker was about to cross the aiming point. Such gross errors did not occur and errors were
minimised by using the 30
Figure 16. sec. line and therefore
working on the linear point
of 0"B, but large errors in range were often encountered.
The partial correction of the picture to display
ground range positions described in paragraph 5. resulted in very bad distortion of the picture at ranges less than the bomb throw. Reference to figure 16 will show that the effect of this type of correction
results in the foreshortening of all returns inside P and to a less extent the elongation of echoes outside this point. A town which should be painted with a diameter equal to LM is painted as L'M' and the mid point N is actually painted much closer to the near fringe at N'. An operator presented with the town painted as M'N' would assess the centre of the town at a point much nearer L', and due to the 'knee' in the curve 0"B it can be imagined that the operator could fly completely over the town thinking that the bombing marker was about to cross the aiming point. Such gross errors did not occur and errors were
minimised by using the 30
Figure 16. sec. line and therefore
working on the linear point
of 0"B, but large errors in range were often encountered.
As the scanner polar diagram was improved and towns were being painted into ground ranges of 12 miles it became necessary to improve the presentation. Earlier the town had changed shape during the approach due to the town fading out at close ranges as well as due to the foreshortening caused by scan distortion. When the whole town is being painted it is important that it be displayed.
Although a complete redesign of H2S, H2S Mark IV, was being developed and would include accurate correction for ground range it was considered important that the Indicator with linear scan in the earlier marks of H2S should be replaced as soon as possible by one giving scan correction, if not as accurately as Mark IV, at any rate without the 'knee' described above.
It should be appreciated that in the design of this new Indicator the designers hands were tied by the Service requirement that it should be completely interchangeable with the old one; size, weight, power supplies, power drain and cables should all remain unchanged.
In the earlier equipments the rotating scan was obtained by passing a saw tooth through a magslip on the scanner, and since a second Indicator (Fishpond) was working from this magslip and this unit had not to be changed in the conversion, the magslip giving linear sawtooths in quadrature had to be retained and any correction done while still using the output of the magslip. The problem was therefore to take two linear sawtooth components varying as Sin ωt and Cos ωt and convert them into hyperbolic scans varying as sinh ωt and cos ωt.
The linear waveform did not bear any fixed phase relation to the transmitter pulse since the transmitter was triggered by a separate valve working from the waveform output (reference para. 3(i)) and therefore could only give Sin ωt and Cos ωt information.
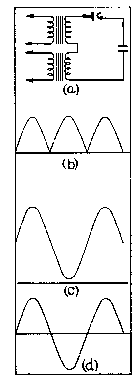 |
Figure 17. |
The first approach to the problem was to feed each linear waveform into a phase sensitive rectifier and obtain D.C. voltages proportional to Sin and Cos ωt. The circuit in Figure 17(a) shows how it was hoped to do this. Whereas rectification of the magslip stator output would give a waveform as in Figure 17(b), the inclusion by means of T2, of a component of constant phase would result in an output as in Figure 17(c).
A suitable change of the D.C. reference level would then convert this to the form required (Figure 17(d)).
This method was made to work quite successfully but due to the number of transformers and other bulky components required it had to be ruled out on space and weight considerations.
The method finally adopted consisted of taking the saw tooth output from the magslip and passing it through a simple R.C. differentiating circuit. Over the operative portion of the saw tooth this circuit gave a close approximation to a square wave of amplitude proportional to the amplitude of the sawtooth, i.e. Sin or Cos ωt.
This square wave was fed to a resistance capacity discharging circuit on the grid of one valve of Figure 17. a long tail-pair amplifier. This grid was normally held at a steady potential by a pair of conducting diodes. A square wave starting at the height marker was impressed on the diode clamps making them non-conducting and allowing the grid potential of the amplifier valve to rise or fall at a rate varying with the sign and amplitude of the square wave from the differentiating circuit.
It can be shown that an approximation to a hyperbola can be obtained by adding two exponential terms to a linear term. Therefore instead of having a simple R and C discharging circuit a circuit as shown in Figure 18 was used. As the height varies, the required hyperbola varies and to achieve this it was necessary to make the resistors of the exponential terms variable and set by the operator for the height at which he was flying.
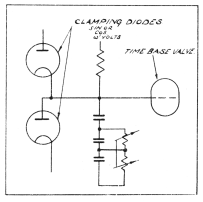
Figure 18.
The output from the anodes of the long tail pair amplifiers was fed to the plates of the PPI. An advantage of this method was that not only was the circuit producing the Sin or Cos ωt voltage very simple, but also by keeping the constants of differentiating circuits the Figure 18. same, a change of scan length automatically gave a proportionate variation in the amplitude of square wave and therefore the required change in writing speeds. Thus there was no need to provide relays for changing the time constants of the discharging circuit. In fact with the new Indicator the various scan lengths are achieved without any switching in the Indicator at all.
 |
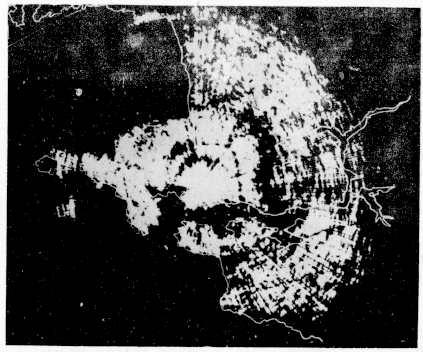 |
Figure 19a. |
Figure 19b. |
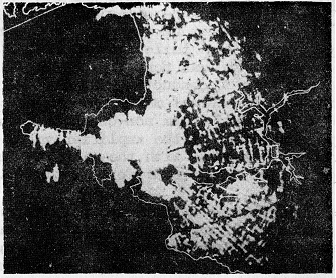
Figures 19a and 19b show the pronounced effect of this scan correction. A thin line shows the true coast outline of the Milford Haven - St. Anns Head area in S. Wales. This is superimposed on Figure 19a on an ordinary uncorrected S band PPI picture of this area, and on Figure 19b on a scan corrected S band PPI picture of the type obtained by using the 184 Indicator described above.
(iii) Pulse Length
If the scan waveform was a perfect hyperbola the writing speed at the centre would be infinitely fast. In actual practice the writing speed is limited by such things as the capacity of the deflector plates and the output impedance of the scan amplifiers. The maximum scan rate achieved is no more than ten times that of the linear scan of the earlier indicator or
the nearly linear portion of the hyperbola. This means that on the shortest range picture for points near the outer edge of the screen the spot Moves 1/40 inches in a microsecond and near the centre of the tube it moves 1/4 inch in one microsecond.
The width of the transmitter pulse is one microsecond therefore the echo from a point object, if at such a range that it appears near the periphery of the tube, paints as a line of length (in the radial direction) of 1/40" but if at a very short ground range it paints as a line ¼" long. On the shortest range picture the radius of the tube 2¼" corresponds to 10 statute miles therefore ¼" corresponds to 1 1/9 miles. Thus objects almost vertically under the aircraft paint as if they were just over one mile long.
From this it would appear that making the scan waveform more nearly hyperbolic has made little or no improvement in the quality of the PPI because in the efforts to remove the foreshortening effect of the linear scan, the fact that the transmitter pulse is not infinitely narrow has resulted in the picture being equally distorted in the opposite direction. This is not true because whereas the shape of a town was lost completely when the fringe was at a ground range of two to three miles, the new indicator still paints faithfully into 1 mile.
The complete picture of the relationship between beam width, scan correction and pulse width is therefore as follows.
At very short ranges a point object shows as a radial line, the lengthening of the return in the circumferential direction due to the finite beam width being negligible but the fast writing speeds, making narrow pulses paint as large radial distances. Near the periphery the echo is a narrow arc and somewhere
between these extremes the signal on the PPI is approximately a square. Since it is impossible to have a point object painting as a single spot on the PPI the best compromise is obviously the square since this means that the
general outline of a town is retained only losing some detail and becoming slightly blurred. The
Figure 20. compromise between pulse
width and beam width should
therefore be such as to have the area of most faithful painting about the bombing point.
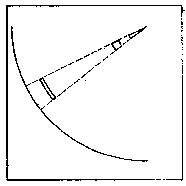
figure 20.
The maximum permissible aperture of antenna is set by aerodynamic considerations. Therefore given the type of aircraft to be fitted and the frequency on which to work a little arithmetic will give the optimum pulse length.
(iv) Recurrence Frequency
It is realised that when going from a beam width of 8° on S band to a 3° beam on X band no corresponding change was made in the pulse length. This was for reasons quite outside the control of the designer.
In all radar equipments the maximum range which can be displayed or used is set by the recurrence frequency. In the time interval between two pulses the C.R.T. spot has to make its writing stroke and flyback, thus allowing 5% of the time interval for the flyback the maximum range which can be displayed is that which corresponds to 95% of the time interval between pulses.
Although the maximum range at which H2S signals of useable amplitude are received is not greater than 50 miles, the Lucero equipment which uses the same synchronising signals and the same, display can work with homing beacons at ranges of 100 miles. The H2S Indicator must therefore be capable of displaying 100 miles and the recurrence frequency it uses must be limited to allow this. The recurrence frequency is therefore limited to about 800 c.p.s.
The relationship between recurrence frequency and pulsed width is a function of the type of-display. The strength of the signal on the PPI is related to the mean power of the received signal and not the peak power. Therefore when using a transmitter of given peak power the PPI signals can be improved by increasing the recurrence frequency or alternatively increasing the pulse width or, of course, both.
When the change from S band to X band was made with a consequent reduction in beam width from 80 to 30, to restore the optimum relationship between beam width and pulse width it would have been necessary to decrease the pulse width from one microsecond to ½ microsecond, but at this stage in the development of the X band technique the peak power of the transmitter was just sufficient to obtain an adequate mean power for good PPI painting when using 1 microsecond pulses at a recurrence frequency of 660 p.p.s. Thus a change to half microsecond pulses would have demanded a recurrence frequency of 1200 p.p.s. to maintain the signal level on the PPI and this was impossible due to the Lucero requirement of a maximum recurrence frequency of 800 p.p.s.
The choice was therefore between having an optimum pulse width for faithful reproductions of town shape with a reduction in the area of ground illuminated, or adequate painting with some distortion of shapes at close range; the latter alternative was obviously the one to be chosen.
There was another alternative, namely to arrange for the recurrence frequency to be changed when switching from H2S to Lucero. This would have enabled the H2S to be operated at a recurrence frequency of 1200 p.p.s. except when Lucero signals were required when a frequency of 600 would be used. There were, however, a number of points in the system where extensive modification would have been necessary before pulses shorter than one microsecond could be used.
The most serious limitation was the band width of the video stages. In H2S Marks I and II although the band width of the I.F. was approx. 6-7 megacycles (vide para. 3(iv)c(i)), amply wide enough for pulses down to 1/3rd microsecond, the band width of the video stages was only 1¾ megacycles. Thus with ½ microsecond pulses the signals would have suffered serious distortion and due to the attenuation of the higher frequencies, a reduction in peak amplitude. To improve the video response would have been a costly modification.
(v) The Stabilised Platform
The later section on scanner design stresses the importance of maintaining an even distribution of power over a wide range of angles of elevation and it will be appreciated that with the scanner fixed to the aircraft as it was in the earlier Marks of H2S this distribution was destroyed if the aircraft departed from straight and level flight.
Figures 3a and 3b show the magnitude of this effect. Since evasive action involving violent turns and dives is a necessary part of all operational sorties, it was desirable that the efficient operation of the H2S equipment should not be restricted to those times when the aircraft was flying straight and level. This meant that the energy distribution over the ground should be maintained by having the scanner fixed relative to the ground and not to the airframe, the scanner should be stabilised.
To this end the scanner was detached from the airframe and mounted in a gimbal ring which was in turn suspended in the airframe so that it could rotate about its axis in the fore and aft line of the aircraft.
This did not allow for any correction to the position of the scanner while the aircraft was diving or climbing (i.e. no stabilisation for pitch) and, due to the space and weight limitations imposed on the scanner assembly by the aerodynamic requirements of the aircraft, it was also necessary to restrict the rotation of the gimbal ring to ± 30° from the symmetrical position. From figures obtained and published by O.R.S., Bomber Command it was seen that although during evasive action the aircraft banked up to 50° and dived at angles as steep as 10° if the scanner was capable of being stabilised against banks of 30° and had no pitch stabilisation, a recognisable picture could be obtained during a large percentage of the sortie.
The stabilisation against roll or bank was achieved by mounting on the scanner platform a gyro capable of giving as positive or negative voltages the amount by which the platform was clockwise or anticlockwise from the horizontal. These voltages were fed through a sensitive D.C. amplifier to a correcting motor. The output of the amplifier caused the motor to return the platform to the position at which there was no output from the gyro and therefore to the horizontal.
Mounted on the same shaft as the motor was a small generator which gave a voltage proportional to the speed of rotation of the motor. The output of this generator was also fed to the input of the amplifier so that it provided electrical damping. The amplitude of the generator output was adjusted relative to the misalignment voltage from the gyro so that the system as a whole was critically damped and the platform returned to the horizontal at maximum speed consistent with no overswing.
Since a small deviation from the horizontal caused misalignment volts to be picked off from the gyro and the correcting motor to operate, the platform never departed appreciably from the stabilised position and in practice the scanner was maintained in the correct position to within ± ¾° throughout the most violent movements experienced by heavy bombers.
Two general views of the stabilising platform are shown in Figure 2la and 21b.
 |
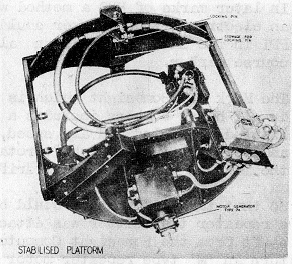 |
Figure 21a. |
Figure 21b. |
(vi) Track Marker
In para. 2 it was stated that the track line was obtained by applying a drift correction to the electrical course marker on the PPI. In early marks of H2S this correction was made by having in front of the PPI screen a rotatable perspex scale on which was engraved a diametrical line, and rotating this scale until the angle between the electrical line of flight marker and the engraved line on the perspex was equal to the drift angle. The engraved line then denoted the aircraft's ground track across the PPI picture.
Since the angle of drift varies with the aircraft's heading this method necessitated working out and setting in by means of the perspex scale, the drift angle each time the aircraft changed course. If the aircraft was not doing a straight and direct approach to the target it was almost impossible for the operator to obtain an accurate ground track.
In later marks of H2S a method was introduced whereby an electrical track marker could be displayed on the PPI in the same manner as an alternative to the course marker.
The Mark XIV Bombsight which is now a universal fitting in all heavy bombers includes a computer which, from a knowledge of wind and air speed, works out the drift and feeds it out as a shaft rotation proportional to the Tangent of the angle of drift.
So that this information could be displayed on the PPI, a repeater transmitter was attached to the drift angle shaft from the Bombsight Computor and this was used to
turn an 'M' type repeater motor on the scanner. The obtaining of the angle of drift from the motor giving tangent of the angle of drift was by means of a simple mechanical triangle solver, the output of this system being used to offset a second switch with respect to the line of flight switch.
Equipment now in service
The equipment now being installed and used in Bomber Command Main Force is H2S Mark II, the salient points of which are:-
The equipment shortly to be introduced in Main Force is:-H2S Mark IIC which has:-
The position in the Pathfinder Force is:-
Page last updated on the 10th February 2018 by Colin Hinson.