1. General Considerations
The H2S scanner rotates continuously to give all round
coverage within a radius of 20 or 30 miles. It gives a wedge shaped beam (Fig. 22) which at any instant illuminates uniformly a sector of this ground area. This beam should be as narrow as possible in azimuth, for the azimuth definition depends inversely on the beamwidth. It also depends inversely on the slant range, so increases steadily as the target moves in. The radial definition however depends on pulse width and angle of incidence to the ground, and decreases as the target moves in. Overall power and gain of the system determine the maximum working range, while the degeneration of radial definition determines the minimum range. Between these limits then the antenna must be designed to operate.
 |
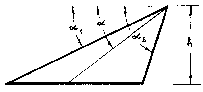 |
Figure 22. |
Figure 23. |
Consider the idealized elevation polar diagram of Figure 23. Since the slant range at any angle a and height h varies as h cosec α, the radiated field in any direction must also vary as cosec α, and the radiated power as cosec²α, for even illumination on the ground. Integration of this field between the limits α1, and α2 leads to the following relations if the same pattern is assumed for transmitting and receiving:
maximum range α √ radiated power...........................(1)
maximum range α 1/height.........................................(2)
The azimuth beamwidth varies directly with the horizontal aperture of the scanner, hence the following relations:
maximum range α horizontal aperture.......................... (3)
maximum range independent of the wavelength ...........(4)
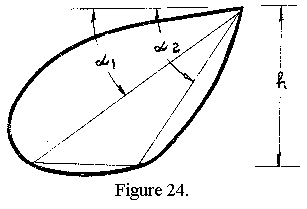
These four relations are based on an idealized vertical pattern,. discontinuous at α1 and α2. The degree of discontinuity obtained in practice depends on the vertical aperture in wavelengths, and when this is small, much of the radiated power may he outside the limits α1 and α2 (Fig. 24). In this case the elevation pattern is dependent on the vertical aperture, and in the limit the following conditions apply:
maximum range α 4√ radiated power.....................(5)
maximum range independent of the height.............(6)
maximum range α √horizontal aperture..................(7)
maximum range 1/√wavelength..............................(8)
(aperture constant)
H2S aerials range between these two extremes. High level (20,000 ft) S band scanners with a vertical aperture of 5λ waste >50% of the power outside α1 and α2, and approach equations (5) to (8); whilst high level K band scanners with an aperture at least 20λ waste < 20% of the power and approach equations (1) to (4). Low level (5,000 ft) aerials on S, X, or K all approximate equations (5) to (8). The gain of a properly designed antenna is dependent not only on its physical dimensions and the wavelength, but also on the expected maximum range and operational height; and only when these are specified has it any meaning. For illustration of the diagrams to be expected on the three wavelengths, high and low level, see Figures 26, 27, 28, 31 and 33.
2. Some particular H2S aerial systems
Any desired continuous radiation pattern can be formed by a finite wavefront having every point specified in amplitude and phase. This wavefront can be produced, just as in optics, by a system of one or more mirrors, lenses, or gratings. Since most of the possible methods are employed in the several versions of H2S, these are discussed in turn.
(a) Mark IIC (S band)
Perhaps the simplest system, used for Marks II and III, consists of a single ("barrel") reflector fed by a waveguide
horn. The azimuth profile is parabolic, whilst the elevation profile is part parabola, part circle (Fig. 25). This composite surface (though a crude approximation to that required for a cosecant diagram on a geometrical optics basis) gives a good pattern on S band from 10° to 65° (Fig.
26). Some control over the polar diagram is obtained by varying the flare of the horn and its position and angle
relative to the reflector. Optimum position is: displaced slightly up from the focal point, and tilted slightly into the circular portion.
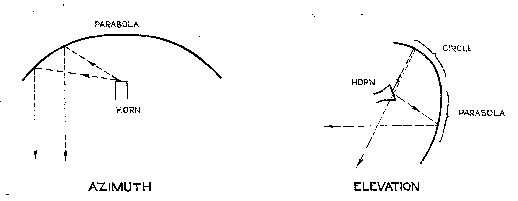
Figure 25. Cross-sections of "barrel" scanner
Flights reports on Mark IIC at 20,000 ft show an equisignal region of ground returns from 25 to 5 miles, another of greater intensity from 5 to 2 miles and little useful signal inside 2 miles (See Fig. 26). Maximum range
on cities is about 35 miles. The diagram cannot entirely explain the inner bright zone, and it is believed to be
caused partially by a vertically polarized component of radiation occurring at depression angles greater than 450. This component, a product of the double reflector curvature,
has a split beam in azimuth cross-section. Its amplitude increases rapidly from 5% of the horizontal component at 10° to over 52% at 70°. Reduction to 10% is possible with a striated reflector: plastic with horizontal metal strips bonded to its surface; but this had not yet been done in production.
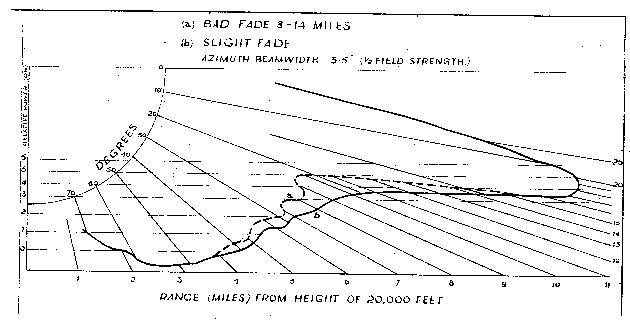
Figure 26. Elevation polar diagram of Mark IIC production Scanner
A reflector surface and horn position tolerance of ± 1⁄16" assures consistent results on Mark IIC. The chief disadvantage of this equipment is its broad azimuth beam-width, resulting in the diffusion of sharp signals into arcs on the PPI. A second disadvantage is the appearance on the tube of alternate bright and dark rings in the fore and aft directions. These are caused by reflection from the fuselage interfering with the direct ground radiation, and are a result of the narrow scanner vertical aperture.
(b) Mark III (X band)
The barrel scanner described above, modified for X-band,
can give a fair cosecant diagram from 10° to 60°. It is
much more critical however than on S-band, and even with a reflector and horn position tolerance of ± 1/32" the diagram is not consistent. Chief variation is in the size of a dip 10° off the peak (Figure 27). The effect of this dip is to give a fade in the picture from 13 to 8 miles. A fade in this position is particularly objectionable since it leads to ambiguities of bright lights and shadows in the larger towns near the bombing point. Even if the diagram does not go through an actual minimum, the suddenly increased field strength of the "bump" gives the effect of a fade on the tube. It is sudden variations, especially those close to the main beam, since they extend over a wider ground zone, that are serious. Gradual variations can be controlled by the gain control. In fact, as there is seldom a large safety factor in power, a gradual increase towards the centre of the tube is preferred, to ensure a steady signal at the bombing point (e.g. (b) in Fig. 27).
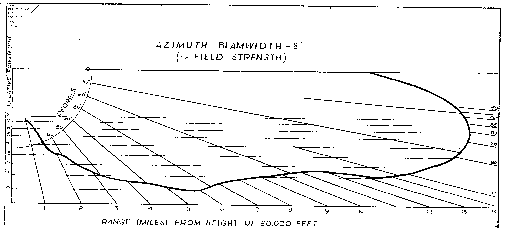
Figure 27. Elevation polar diagrams of two Mark III production scanners
The polar diagram is designed for maximum range at one operating height, normally 20,000 ft. However, the scanner should be sufficiently flexible to give reasonable ranges at altitudes down to 10,000 ft. On S band the broad elevation pattern radiates nearly as much power at 5° as at 10°. Therefore the maximum range at 10,000 ft is still greater than 25 miles, though the picture is not as even as at 20,000 ft. But on X (and K) the cut off is so sharp that an adjustable tilt is necessary. In the latest X band scanner, now under development, three positions are available, which put the peak at 7°, 12° or 20°. This last position is for the 10 mile range only, to improve the minimum range and increase the signal strength generally. It should be pointed out that the normal 8 - 13 mile fade is more pronounced on the 20° position, though its range and width are decreased. (See Figure 28). At 20,000 ft the maximum range to be expected with Mark III from cities is 30 miles; ground returns extend from 20 to 2 miles, with a bright zone from 6 miles inwards.
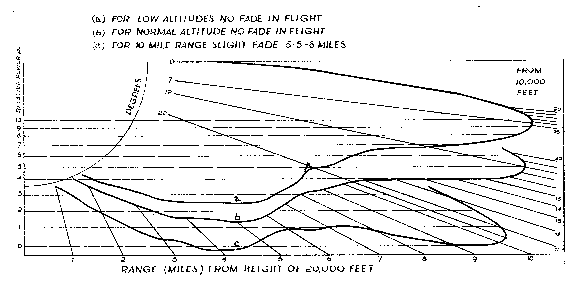
Figure 28. Elevation polar diagrams of experimental adjustable tilt Mark III scanner
There are two approaches to a better design on X-band. One is the principle outlined in the next section under Mark VI. Another is a more complex barrel type reflector, having a "designed" elevation cross-section, and azimuth parabolic cross-sections of varying focal lengths. The increased difficulty of manufacture might be more than outweighed by the less critical nature of the new surface.
(c) Mark VI (K band)
If, instead of forming the beam in azimuth and elevation with a single reflector, it is done in two steps each reflector will have only a single curvature. This eases the production problem, making possible close tolerances, and more complex contours. Cross-polarised radiation, a product
of double curvatures, is practically eliminated. The azimuth beam is formed first (Fig. 29) by a horn feeding a thin parabolic slice bounded by two flat plates. The spacing tolerance on this "cheese" need not be <0.030" since
vertical polarization is used. This linear radiator is then used as the primary source of a cylindrical reflector.
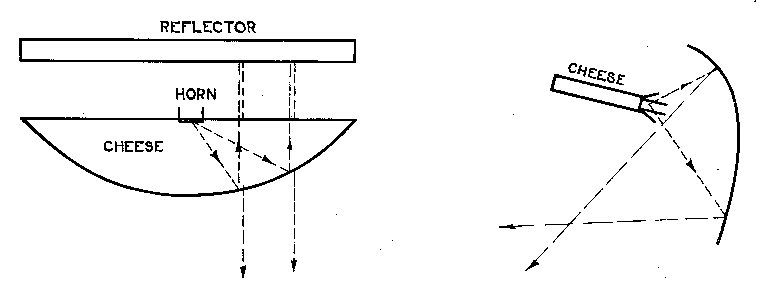
Figure 29. Cross-sections of "cylinder" scanner
With a vertical aperture > 10λ a good first approximation to the correct cosecant contour can be calculated from geometrical optics. The additional assumptions must be that no sudden discontinuities exist in the primary pattern or on the surface of the reflector (i.e. radiation must reduce to almost zero at the edges).
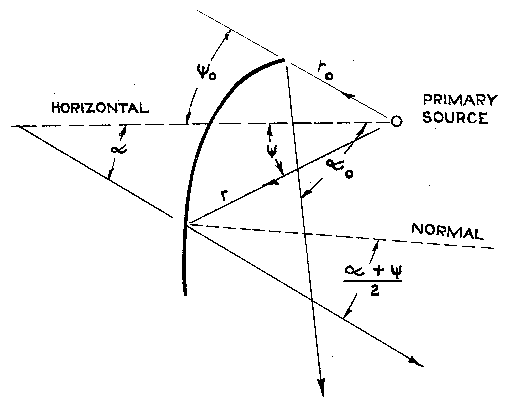
Figure 30.
Let ψ be the angle of the incident ray
α be the angle of the reflected ray
r be the distance from the primary source to the reflector
αo, ψ0 and r0 be the values at one limit
Iψ be the intensity of the primary radiation
I be the intensity of the secondary radiation
Now α0∫α Iα dα =
ψ0∫ψ Iψ d ψ
And if Iα = K cosec2α
K (cot αo - cot α ) =
ψ0∫ψ Iψ d ψ ..............(1)
In addition it can be shown that
loge r/r0 =
ψ0∫ψ tan (α+ ψ)⁄2 d ψ .............................(2)
The primary pattern can be measured, so graphical integration solves the right hand side of equation (1), and substitution of the second limit determines the constant K. With α as an explicit function of ψ, further graphical integration in equation (2) gives r as a function of ψ, and the reflector contour is specified.
Refinements to the Mark VI scanner consist of a special polythene lens at the horn, and baffles on the cheese. The lens broadens the horn pattern into a double humped azimuth beam, thus illuminating the parabolic slice more uniformly, and narrowing the resultant azimuth beam. The baffles (which are fastened almost at right angles to the two outside surfaces of the cheese just back from the mouth) interrupt primary back radiation which would interfere with secondary radiation from the reflector. Some care must be taken to avoid diffraction around the top and bottom edges of the mirror, since in contrast to the field from the horn of the barrel scanner, the field from the cheese is a well focused beam. It will thus add and subtract directly from the reflected field of the cylinder.
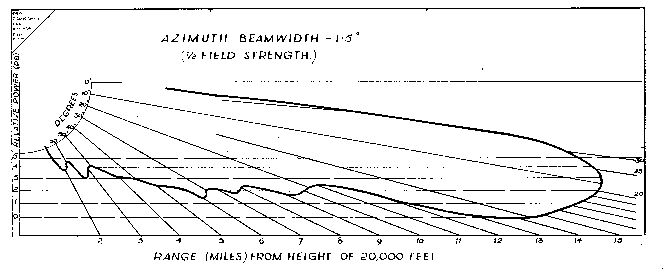
Figure 31. Elevation polar diagram of Mark VI experimental scanner
(d) Mark IIIC (X band)
An increase of horizontal aperture from 3 ft to 6 ft logically calls for a change to the cylindrical construction due to the limited depth. However, rather than a cheese for the primary radiator, a non-resonant waveguide array of edge slots is used. Such an array can be exactly designed to give any amplitude distribution along its length, so that theoretical beamwidths for a given aperture can be realised. Usual practice is to "gable" the distribution to reduce minor lobes (from say 22% to 10% at a slight sacrifice of beamwidth (10%). The beam of a non-resonant array must be squinted a few degrees off the normal, but this is easily compensated for mechanically (Figure 32).
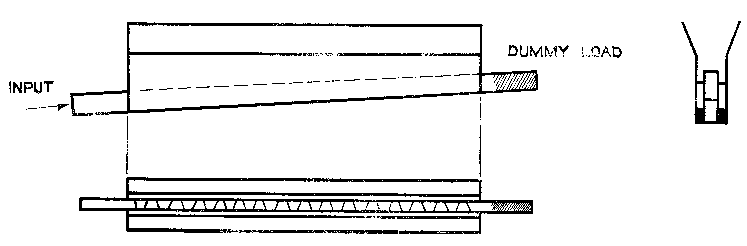
Figure 32. Slotted waveguide primary feed
In a non-resonant array the resonant slots are alternately phased, and are spaced at intervals of 180 + Δ electrical degrees in the guide; and the guide is terminated in a dummy load absorbing a few per cent of the total power.
Each slot radiates a portion of the power passing it down the guide, this fraction increasing as the slot position towards the load end. Steps in the design are:
Most of the above values are available in graph or table form.
The only Mark IIIC flights have been with a slightly different design of scanner, but maximum ranges of 35 miles on cities, and 30 miles on ground return were reported. The above design should result in a considerable increase over these ranges.
3. Low-level high-definition scanners (X and K band)
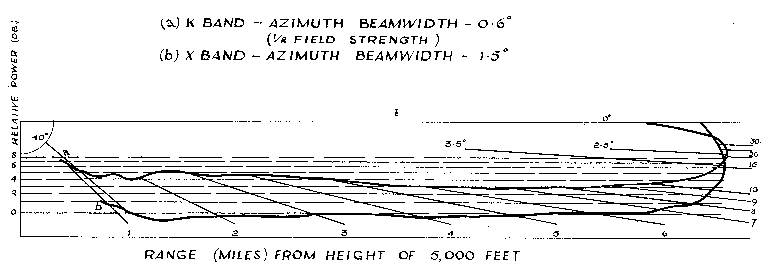
Figure 33.
Elevation polar diagrams of experimental low level scanners
Low level scanners require coverage down to only 35° or
45° (See Fig. 33). For this reason simpler antennas may be
used: a slight spreading on the ground side of a single
lobe being sufficient. A horn pattern is naturally cosecant over a limited angle, so, together with a slotted array, has been used on both X and K band. On X band the horn is asymmetrical to give the coverage, on K it is symmetrical but a small prism in the aperture diverges the beam (Fig.32A). Both scanners have a 6 ft horizontal aperture.
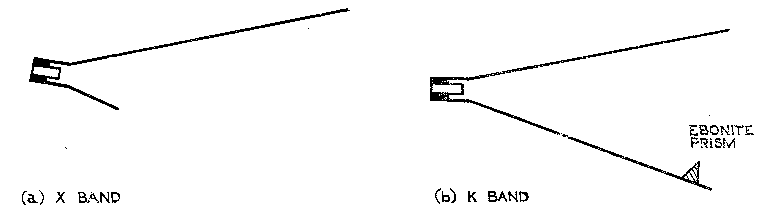
Figure 34. Cross-sections of low level "horn" scanners
4. Conclusions
As yet there has been no consistent practical realisation of the theoretically desirable polar diagrams described in this article. In particular the X band scanner has shown great variations in its elevation coverage and a considerable effort is still being made to realise a more consistent production article. It is becoming apparent that we may have reached the limits of tolerance which can be held in mass production on these types of scanner and radical new designs may be necessary in order to make X and K band scanners a practical manufacturing proposition. Future designs will also be influenced by the need for more rapid (or sector) scanning in order to make full use of the increasing azimuth and radial definition which is becoming available.
Page last updated 10th February 2018 by Colin Hinson.